Green Bar Chart 3D Model
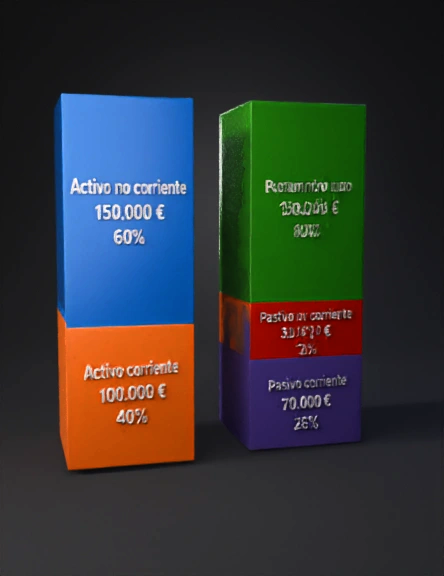
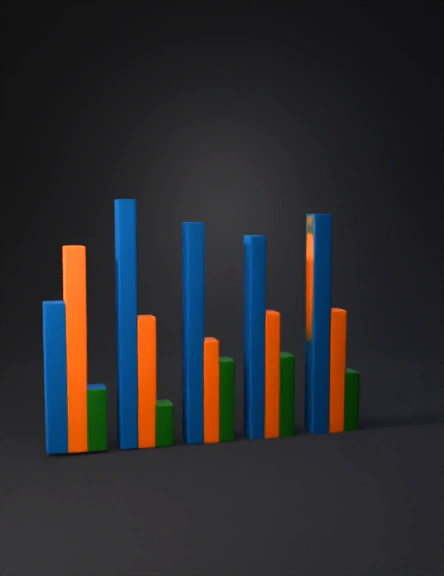
3d Bar Chart Infographic 3D Model
Growth Chart 3D Model
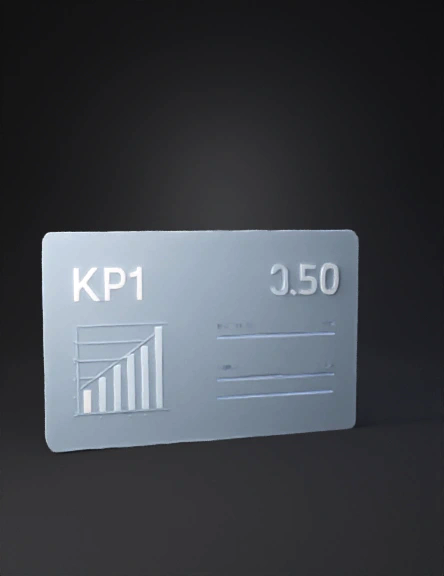
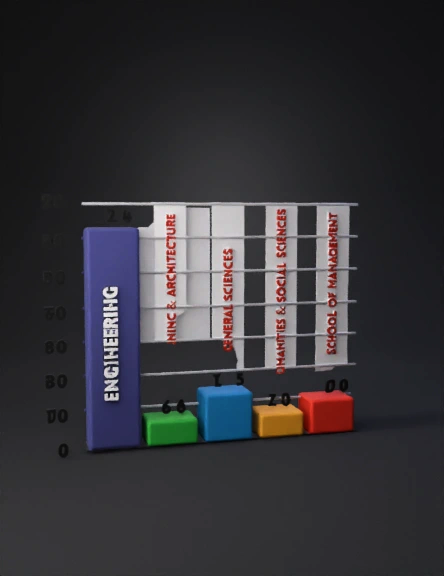
Holographic Dashboard 3D Model
Bar Chart 3D Model
Bar Chart 3D Model
Bar Chart 3D Model
Grafana Logo 3D Model
Bar Chart 3D Model
3d Bar Chart 3D Model
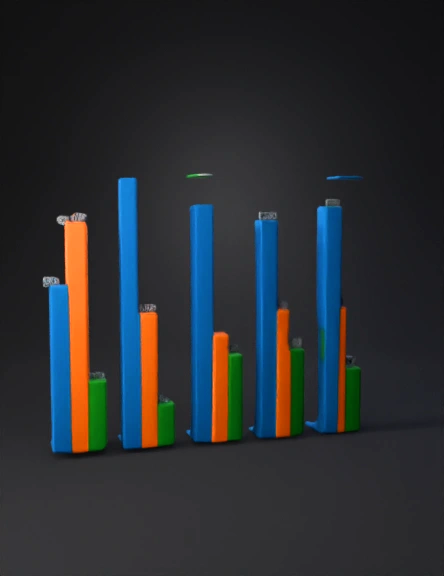
Ascending Bar Graph 3D Model
Gráfico De Barras 3d 3D Model
3d Bar Chart 3D Model
Bar Chart 3D Model
Colorful Chart 3D Model

3d Bar Chart Model 3D Model

Bar Chart 3D Model
Гистограмма 3d Модель 3D Model