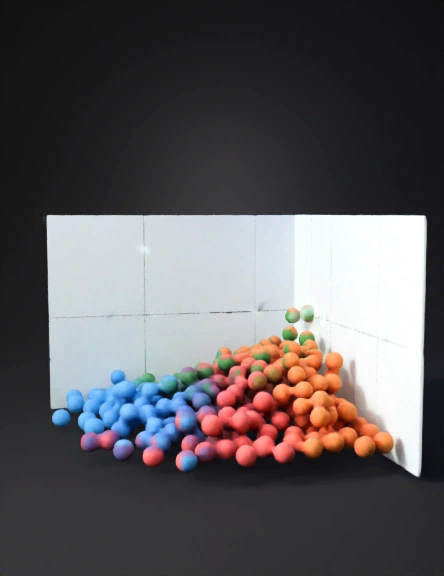
four-cluster data visualization 3d model
Create a highly realistic, educational 3D visualization representing unsupervised machine learning clustering based on real-world numerical data. The scene should show a 3D Cartesian coordinate system with clearly visible X, Y, and Z axes, labeled as Feature 1, Feature 2, and Feature 3. Axes should include subtle grid lines and numeric tick marks to resemble an actual data science scatter plot. Plot hundreds of individual data points as small, smooth spheres, distributed naturally in space, forming four distinct clusters. Each cluster must be visually separated and colored differently (for example: blue, red, green, and orange). Each cluster should have: Dense concentration near the center Gradual spread outward (Gaussian-like distribution) Slight randomness in point placement to simulate real-world noisy data Add cluster centroids at the center of each group, represented by larger solid spheres, matching the color of their respective cluster.
4K·v3.0-20250812


