3D Workspace
Home
Assets
Affiliate Program
Creator Program
Sign up/Log in
View Plans
DCC Bridge
Anonymous1762623451
11-08 17:39
Model Name
data science infographic 3d model
Tags
abstract symbol
abstract symbol modern
abstract symbol rendering
abstract symbol rendering modern
data
modern
rendering
rendering modern
Prompt
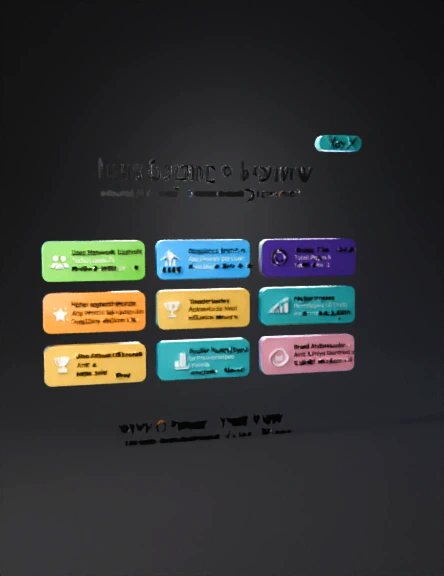
Create a professional 4K LinkedIn infographic titled "Data Science Journey" with subtitle "Analyzing User Engagement & Influence". Use a soft cyan-to-navy gradient background with modern tech-inspired typography (Poppins font). Include a small teal rounded label on the top-right corner reading "Day 4". In the middle section, arrange seven colorful rounded boxes with vivid colors (green, blue, purple, orange, yellow, teal, pink) and corresponding icons (👥 📈 🔥 🌟 🏆 📊 ✅). Each box should contain: 1. User Network Analysis – Total Users: 4, Total Friendships: 6 2. Engagement Metrics – Avg Friends per User: 1.5, Avg Likes per User: 1.0 3. Content Popularity – Total Pages: 4, Total Likes: 4 4. Influence Scoring – Top Influencer: Amit, Influence Score: 3 5. Top Influential Users – Amit 🥇, Priya 🥈, Sara 🥉 6. Popular Pages Ranked – Python Developers (2 likes), AI & ML Community (1 like) 7. Brand Ambassador Candidates – Amit & Priya identified as potential ambassadors Bottom section should include the quote "Data tells stories. We just listen." and footer "Jamshed Alam — Aspiring Data Scientist | Python & ML Learner". Apply professional spacing, subtle shadows for depth, crisp typography, and a clean minimalist layout optimized for LinkedIn sharing.
Detailed Info
Related Models
Enter invite code
Enter invite code to get credits!